Here at DemandCaster, we use Excel every day. In fact, the original version of DemandCaster was built using Excel and a number of advanced Excel tricks. All DemandCaster reports are defaulted to output as Excel and Excel can be used to easily prepare and then upload user defined forecasts and other updates as tab delimited text files.
Our custom report configurator is also Excel friendly. Using the custom reports, users can prepare and upload pre-formatted excel templates that include graphs, tables, and other excel tricks and functions. Each time the custom report is run, the template is refreshed with the latest data allowing DemandCaster to be a comprehensive business intelligence reporting system that is tailored to meet the needs of your company. We even added the functionality to load additional data sets into the DemandCaster database beyond it's required data.
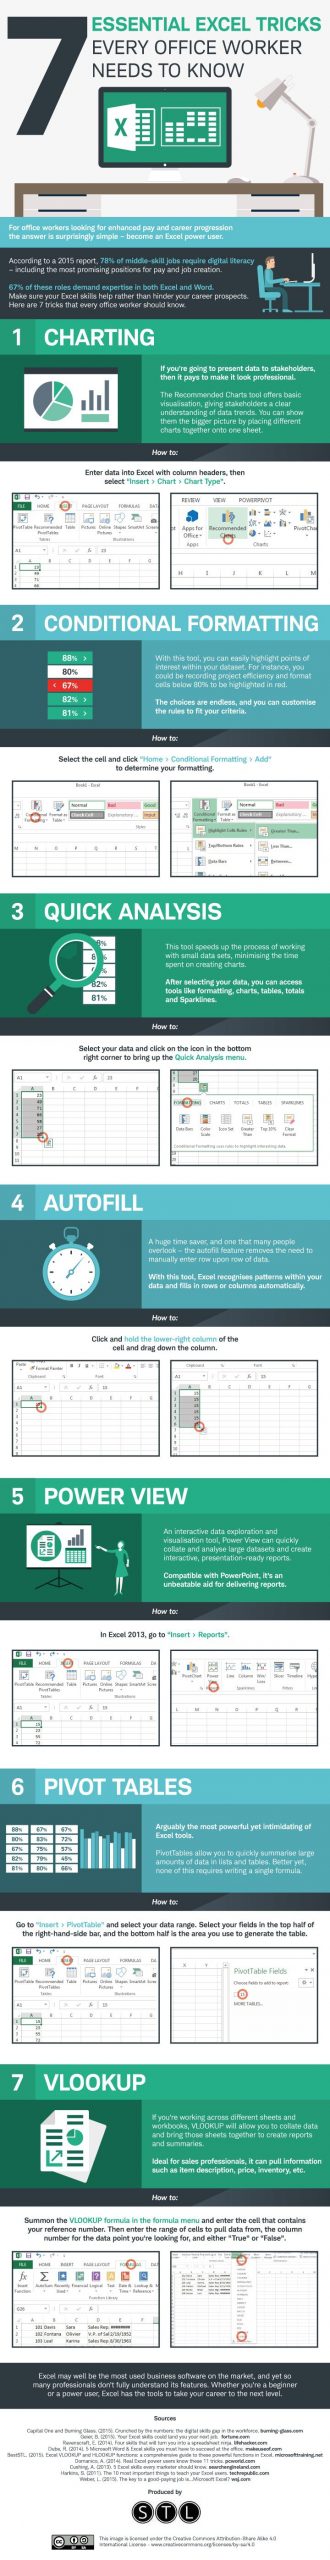
With this in mind, we recently discovered and would like to share a neat infographic from Microsoft Training that provides a list of the Seven Essential Excel Tricks every Office Worker needs to know. We hope you can use these tricks to build your own custom templates or improve your analysis of the data generated by DemandCaster. We realize that not all our customers are Excel savvy, so as we discover these tips and tricks, we will post them to this blog under the Reporting category.
Now that you have read the infographic, here are three video's that we have posted on our YouTube page that provides a more detailed description of how to use Excel to create a custom filtered report.