————
Thank you for your interest in DemandCaster.
The Excel template referenced in this blog is no longer available but click here to learn how the DemandCaster software system can be used to support your S&OP process. And to learn more about S&OP, refer to these articles What is S&OP? and Implementing Sales and Operations Planning.
Contact Us if you would like to speak to a DemandCaster representative.
————
It’s that time again! The third S&OP Excel Template in the series is here! Everyone here at DemandCaster is thrilled with all the positive feedback we have been receiving and an unprecedented amount of followers to this series. I am humbled to see this series is reaching such a large audience and I thank all of you that have helped by sharing this series on your social media networks. I appreciate your support and glad to see everyone is enjoying the templates, If you missed previous templates, check them out: Forecast Consumption Template and Demand vs. Supply Template or subscribe to receive the series of 4 by completing the subscription form located at the top of the side-bar on this page.
This week we are giving away a very basic template that is extremely important to the business, Sales Forecast Financial Overview. These reports in the template provide the executive team a high-level view to begin the evaluation of the financial performance of sales forecast. Before we get into the details of the reports in the template I wanted to mention the new Custom Reporting feature in DemandCaster, which inspired this series.
S&OP Excel Template series brought to you by DemandCaster
DemandCaster Custom Reporting is a report engine that leverages Microsoft Excel. It allows users to pull all the data that exists in DemandCaster and use that data to create custom reports and dashboards using user-designed templates that can produce an array of outputs, from graphs to pivot tables and allows for the inclusion of macros. The templates we are sharing in this series of S&OP Excel Templates all work with the DemandCaster custom reporting tool. The result is your Excel dashboards can be downloaded out of the system at any time with the most up to date data without the fear of any calculation or link breaking. In addition, the data can be posted to other data tables on a scheduled basis allowing users to use services such a Tableau or other reporting services. The report may also be emailed to dedicated users on a scheduled basis. You can find out more information on custom reporting by Clicking Here. Below are a few slides to show you how quick and simple this feature is to use and setup with your Microsoft Excel templates.
[metaslider id=1363]Sales Forecast Financial Overview
This template was designed to be user-friendly and contains a detailed set of instructions, preview below:
[metaslider id=1398]The purpose of this Spreadsheet is to give a visual chart of your rolling 12-month forecast from a financial perspective. There are TWO REPORTS in this template, one by individual product and one for overall of the company, breaking the revenue down between cost and margin. This is an important first round view in the S&OP process to evaluate what to expect over the next 12 months from a financial perspective.
Sales Forecast Financial Overview Report #1: Overall Projected Margin
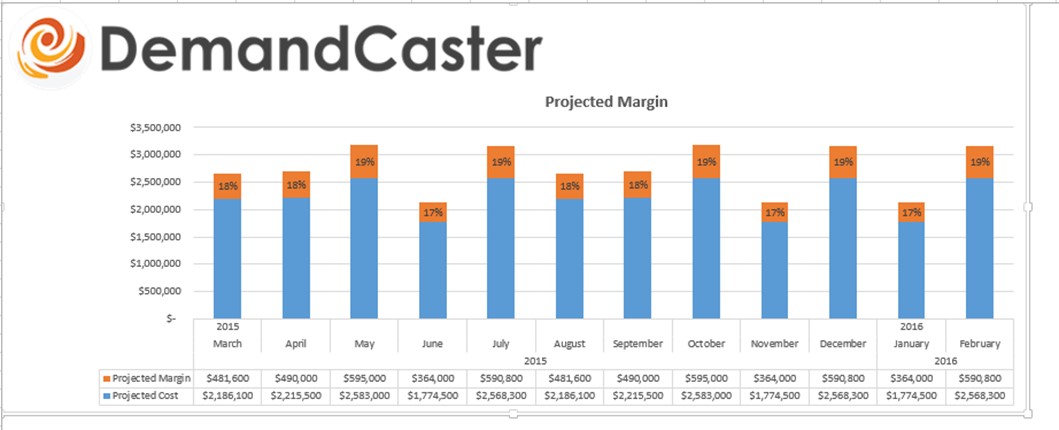
Once all the inputs are in, the chart will show you the company overall total revenue broken into cost and margin while also giving you the percent of margin per month.
Sales Forecast Financial Overview Report #2: Projected Margin by item
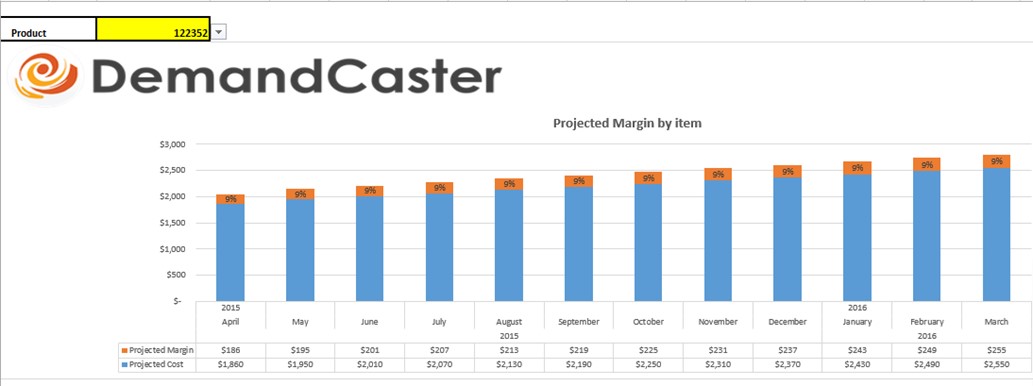
Once all the inputs are in, the chart will show you the individual items total revenue broken into cost and margin while also giving you the percent of margin per month. The yellow highlighted cell at the top of the sheet is a drop down menu, select the item you want to see and the chart will be populated with that items data. Required Data:
- List of Products
- 12 month product unit forecast
- Cost for each product
- Sales price for each product
The directions can be found in the second tab of the Spreadsheet titled “Directions” to download this Microsoft Excel Template please fill out the sign up form below and the file will be emailed to you.
Final Thoughts
If you have not already signed up to receive these templates, please complete the subscription form at the top of the right side-bar on this page.
Once again we hope you find these Microsoft Excel Templates useful. Please share with your fellow peers! If you have any questions or would like more information on what we have to offer at DemandCaster, please feel to contact us, we are always happy to hear from our readers.